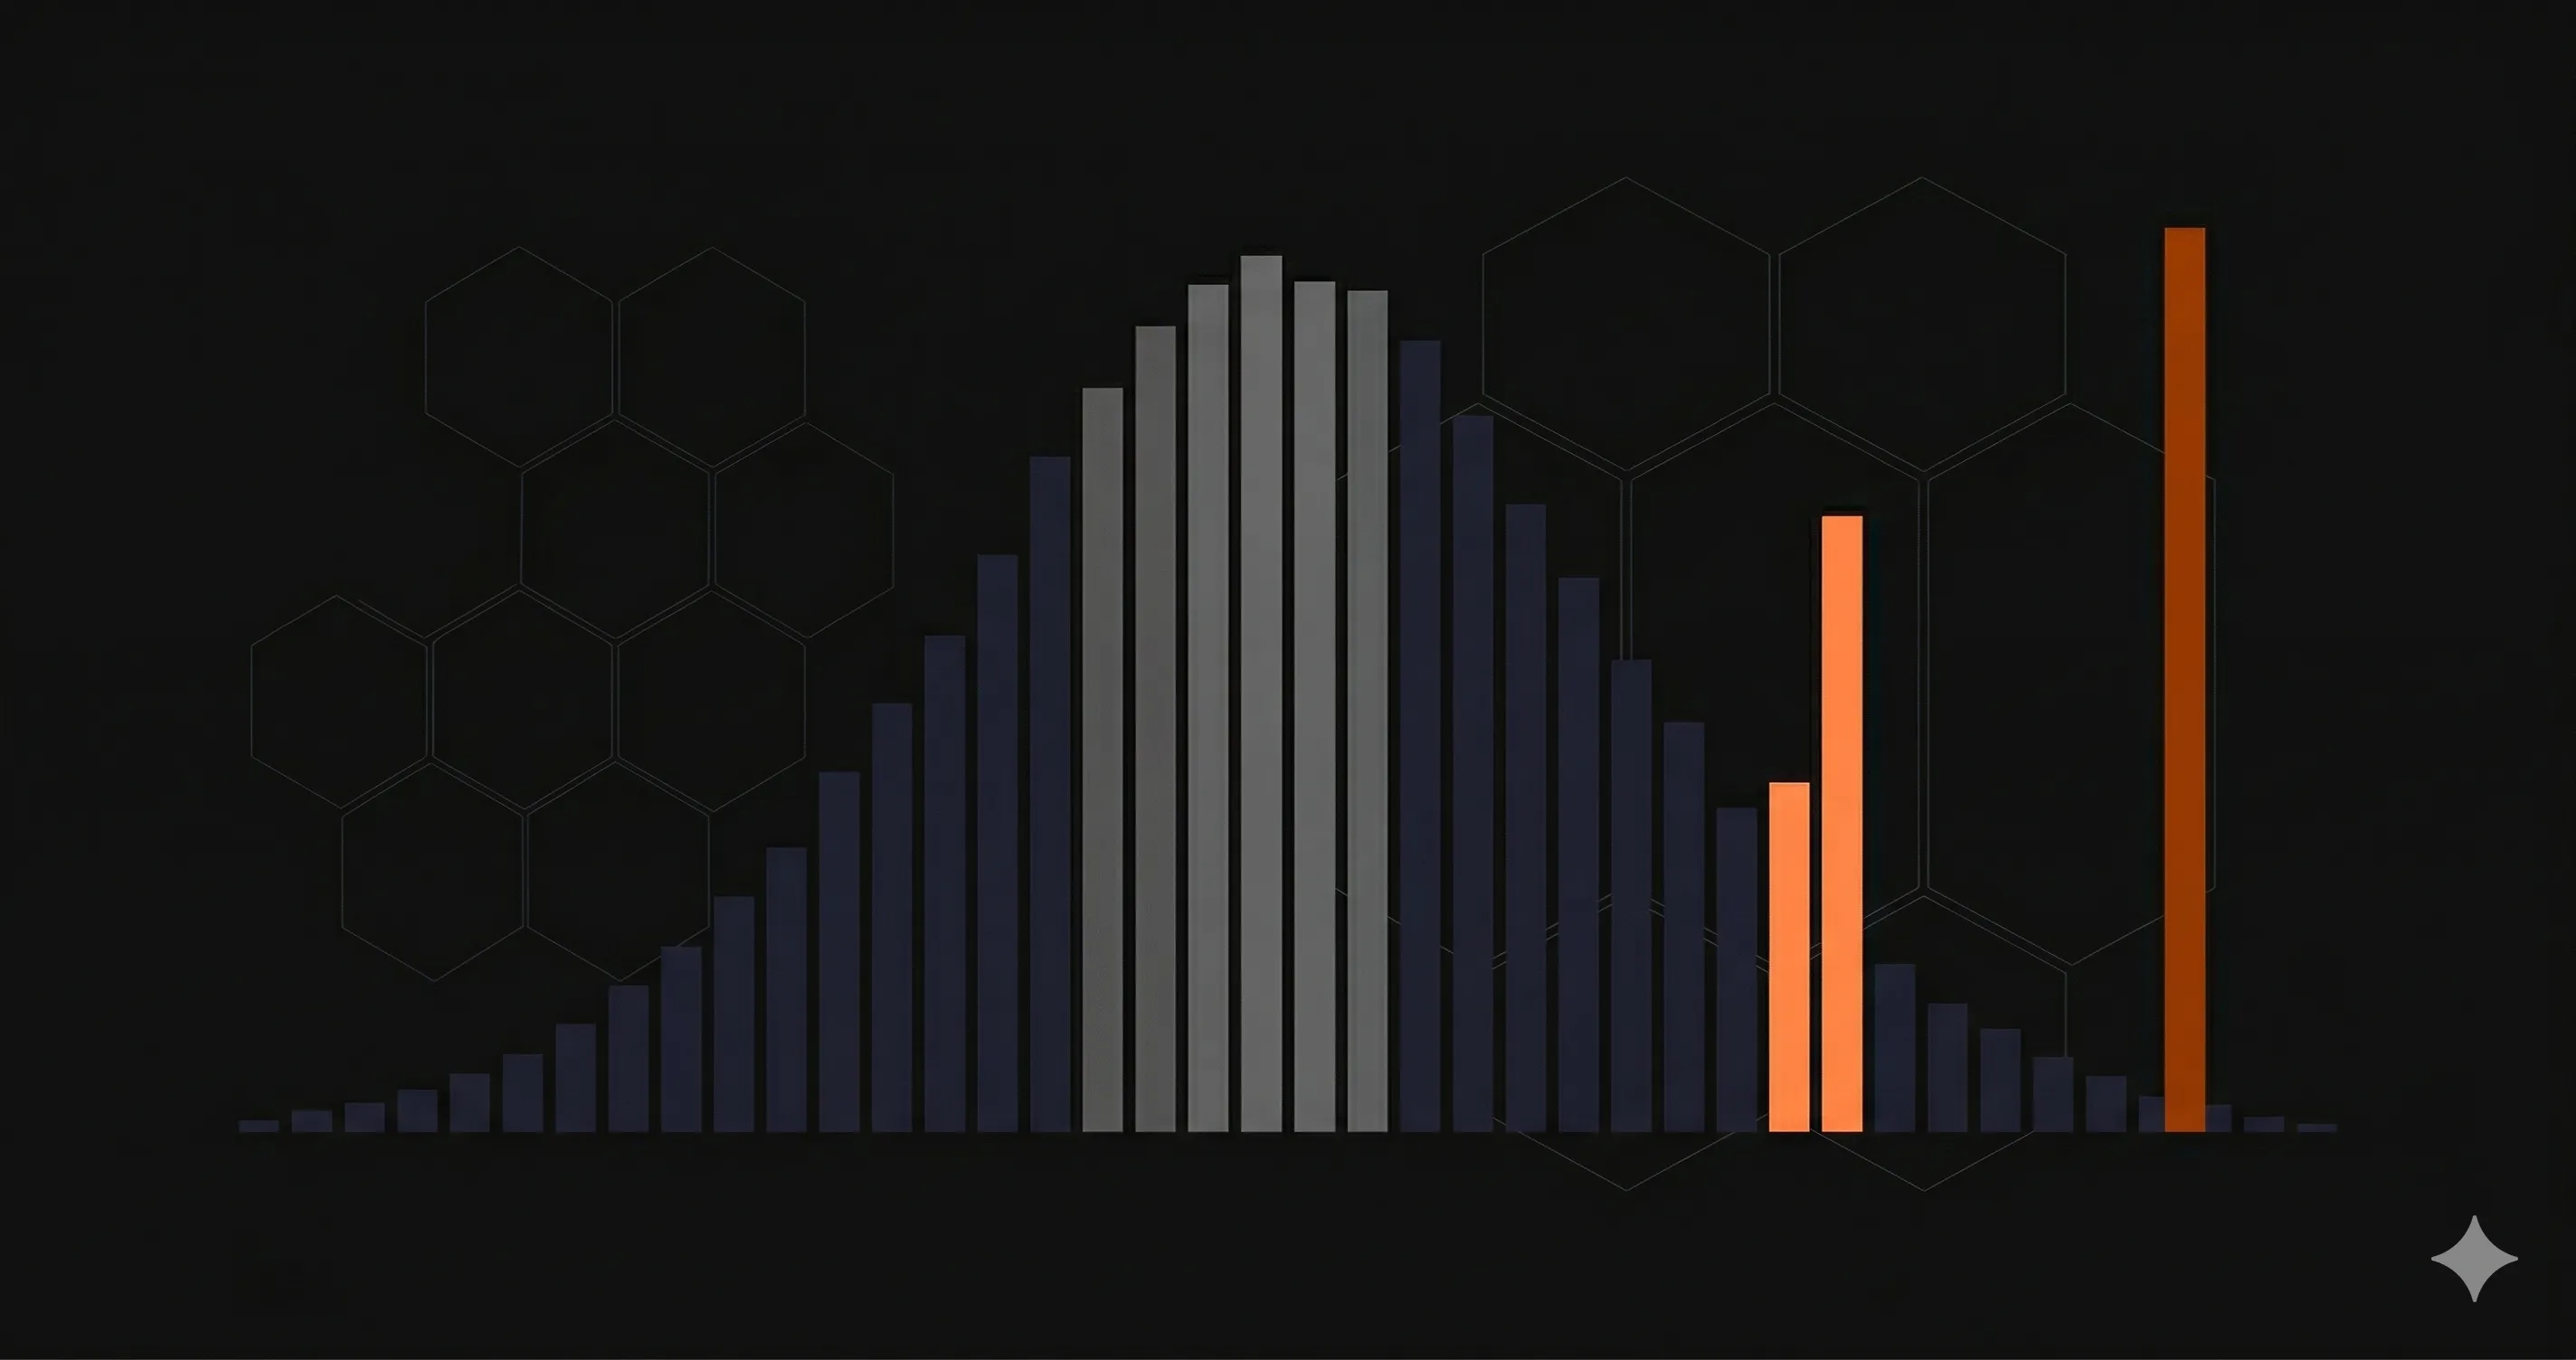
P95 latency, in one sentence: P95 latency is the response time that 95% of your requests beat, only the slowest 5% take longer. If your P95 is 400ms, then 95 out of every 100 requests finish in 400ms or less. It measures the experience of your slowest regular users, which averages hide. A good P95 is under 500ms for a public REST API and under 100ms for an internal microservice.
Your API's average response time is 120ms. Sounds fast. Your team is happy. Your dashboard is green.
But 1 in 20 of your users is waiting over 2 seconds for every request. They are not happy. They are leaving.
This is the problem with averages. They hide the worst experiences behind a comforting number. P95 latency fixes this by showing you what your slowest typical users actually experience, and it is the single most important performance metric for any production API.
This guide explains what P95 latency is, why it matters more than average response time, how to calculate it, and what good targets look like for different API types. If you are already monitoring response times but only looking at averages, you are flying blind on the metric that matters most.
What Is P95 Latency?
P95 latency (95th percentile latency) is the response time below which 95% of all requests complete. Put differently: if your P95 is 400ms, then 95 out of every 100 requests finish in 400ms or less.
Think of it like a queue at a coffee shop. The average wait might be 3 minutes. But if you are the unlucky person behind someone ordering 12 custom drinks, you wait 15 minutes. The average did not warn you. The P95 would have, it captures the experience of the person near the back of the line, not just the people at the front.
Percentile metrics work by sorting all response times from fastest to slowest, then picking the value at a specific position:
- P50 (median)The middle value. Half of requests are faster, half are slower. This is your "typical" experience.
- P9595% of requests are faster than this. This captures the experience of your slowest regular users.
- P9999% of requests are faster than this. This is the worst-case scenario for all but the most extreme outliers.
P50 vs P95 vs P99: Comparison Table
| Metric | What it tells you | Who it represents | When to use it |
|---|---|---|---|
| Average | Arithmetic mean of all response times | Nobody, it is a mathematical abstraction | Rough overview only; never for SLAs |
| P50 (median) | The middle response time | Your typical user | Understanding baseline performance |
| P95 | 95% of requests are faster | Your slowest regular users (1 in 20) | SLAs, alerts, performance budgets |
| P99 | 99% of requests are faster | Your worst-case users (1 in 100) | Debugging tail latency, critical paths |
For most teams, P95 is the sweet spot. P50 is too optimistic, it ignores the bottom half of your user experience. P99 is useful for debugging but too noisy for alerting (a single slow garbage collection pause can spike P99 without indicating a real problem). P95 balances signal and noise.
P95 vs P99 Latency: Which Should You Use?
Use P95 for alerting and SLAs; use P99 for debugging the worst tail. P95 tracks the slowest 1-in-20 requests and is stable enough to alert on without constant false alarms. P99 tracks the slowest 1-in-100, it surfaces rare, extreme outliers (cold starts, lock contention, GC pauses), but it is noisy because a single unlucky request moves the number. Teams running latency-critical systems (payments, trading, real-time) watch both: P95 as the day-to-day health signal, P99 as the early warning that something is wrong deep in the tail. If you can only track one, track P95.
Why Average Response Time Is Misleading
Here is a concrete example. Imagine your API handles 1,000 requests in a 5-minute window:
- 950 requests complete in 80-150ms
- 45 requests complete in 800-1,200ms
- 5 requests complete in 4,000-8,000ms
The average response time? About 200ms. That looks fine on a dashboard.
The P95? About 1,100ms. That tells a completely different story, 50 of your users in that 5-minute window waited over a second for every request.
// The same data, two very different stories:
// Average:  200ms  -- "Our API is fast"
// P95:    1,100ms  -- "5% of users wait 5x longer than expected"

// If you serve 100,000 requests/day:
// - 5,000 requests per day are unacceptably slow
// - That is 5,000 moments where a user considers switching to a competitor
The average is mathematically correct. It is also practically useless for understanding real user experience. Averages are dragged down by fast requests and dragged up by slow ones, the resulting number does not represent anyone's actual experience.
This matters especially for REST API monitoring, where a small percentage of slow endpoints can degrade the entire user experience while your average looks healthy.
How to Calculate P95 Latency
To calculate P95 latency: collect every response time, sort them from fastest to slowest, then take the value at the 95th-percentile position (multiply the count by 0.95). Sort all values, then pick the one at the desired position. Here is a JavaScript implementation you can use for testing or lightweight monitoring:
/**
* Calculate percentile from an array of response times
* @param {number[]} values - Array of response times in ms
* @param {number} percentile - Percentile to calculate (0-100)
* @returns {number} The value at the given percentile
*/
function calculatePercentile(values, percentile) {
  if (values.length === 0) return 0;

  const sorted = [...values].sort((a, b) => a - b);
  const index = Math.ceil((percentile / 100) * sorted.length) - 1;

  return sorted[Math.max(0, index)];
}

// Example: 20 response times from a real API
const responseTimes = [
  45, 52, 61, 67, 72, 78, 83, 89, 95, 102,
  110, 118, 125, 140, 165, 210, 380, 520, 890, 2100
];

console.log('P50:', calculatePercentile(responseTimes, 50));   // 102ms
console.log('P95:', calculatePercentile(responseTimes, 95));   // 890ms
console.log('P99:', calculatePercentile(responseTimes, 99));   // 2100ms
console.log('Avg:', responseTimes.reduce((a, b) => a + b) / responseTimes.length); // 265ms

// Average says 265ms -- "fast API"
// P95 says 890ms -- "5% of users have a bad experience"
In production, you would not calculate percentiles from raw arrays. Monitoring tools use algorithms like t-digest or HDR histograms that can compute accurate percentiles over millions of data points without storing every value in memory. Prometheus uses histogram buckets, Datadog uses DDSketch, and most uptime tools calculate P95 from their health check results.
P95 Latency in Grafana and Prometheus
If you already use Prometheus, you calculate P95 latency from a histogram metric with histogram_quantile. In Grafana, drop this into a panel query:
# P95 latency (in seconds) over a 5-minute window, from a Prometheus histogram
histogram_quantile(0.95, sum(rate(http_request_duration_seconds_bucket[5m])) by (le))

# P95 broken down per endpoint (route label), the version you actually want
histogram_quantile(0.95, sum(rate(http_request_duration_seconds_bucket[5m])) by (le, route))
The accuracy of that number depends entirely on your histogram bucket boundaries: if your buckets jump from 250ms to 1000ms, Prometheus can only estimate P95 somewhere in that range. Tools that store real distributions (t-digest, DDSketch) avoid this bucketing error. If you don't want to run and tune a Prometheus + Grafana stack just to see per-endpoint P95, a hosted monitor computes it for you.
How to Monitor P95 Latency
Knowing what P95 is means nothing if you are not actively monitoring it. Here is what a practical P95 monitoring setup looks like:
1. Collect response times per endpoint
Global P95 across all endpoints is a starting point, but it hides slow endpoints behind fast ones. If your GET /api/users has a P95 of 50ms and your POST /api/reports has a P95 of 3 seconds, the global P95 might look acceptable while one critical endpoint is broken.
Always break down P95 by endpoint, by method, and by status code.
2. Set alerts on P95, not averages
Configure alerts that fire when P95 latency exceeds your target for more than 5 minutes. A single spike is noise. A sustained P95 increase means something changed, a slow database query, a cold start issue, or a downstream dependency that is degrading.
// Alert configuration example (pseudocode):
// Metric: p95_latency_ms
// Condition: > 500ms for 5 consecutive minutes
// Severity: Warning
//
// Metric: p95_latency_ms
// Condition: > 1000ms for 5 consecutive minutes
// Severity: Critical -- page the on-call engineer
3. Track P95 trends over time
A P95 that creeps from 200ms to 300ms over two weeks is harder to notice than a sudden spike, but it is just as dangerous. Plot P95 on a time-series chart and look for upward trends that correlate with deployments, traffic growth, or database size increases.
4. Compare P95 across regions
Users in São Paulo might have a very different P95 than users in Frankfurt. Multi-region monitoring exposes geographic performance gaps that global aggregates miss. For a deeper look at how DNS, TLS, and TTFB contribute to regional latency differences, see our guide on monitoring REST API performance metrics.
What Is a Good P95 Latency? (Targets by API Type)
A good P95 latency is under 500ms for a public REST API, under 100ms for an internal microservice, and under 300ms for a payment or checkout flow. There is no single universal number, the right target depends on what your API does and who consumes it. Here are practical targets based on industry benchmarks:
| API Type | Good P95 | Warning | Critical |
|---|---|---|---|
| Internal microservice | < 100ms | 100-250ms | > 250ms |
| REST API (public) | < 500ms | 500-1,000ms | > 1,000ms |
| GraphQL API | < 800ms | 800-1,500ms | > 1,500ms |
| Payment / checkout | < 300ms | 300-600ms | > 600ms |
| Search / autocomplete | < 200ms | 200-400ms | > 400ms |
| Webhook delivery | < 1,000ms | 1,000-3,000ms | > 3,000ms |
| File upload / processing | < 2,000ms | 2,000-5,000ms | > 5,000ms |
| Real-time / WebSocket init | < 150ms | 150-300ms | > 300ms |
These targets assume the user is in a region with a monitoring check point nearby. If your API serves users globally but is hosted in a single region, your P95 for distant users will naturally be higher due to network round-trip time. Multi-region monitoring that checks from several continents lets you see per-region P95 instead of a single blended number.
Common Causes of High P95 Latency
When your P95 spikes, here are the most common culprits to investigate:
- Cold startsServerless functions (Lambda, Vercel Functions) take 200-2,000ms to initialize. This only affects a small percentage of requests, which is exactly why it shows up in P95 but not in averages.
- Database query performanceA missing index on a growing table gets progressively slower. The query plan changes once the table crosses a size threshold, and suddenly 5% of requests hit a sequential scan.
- Garbage collection pausesIn Node.js, Java, or Go, GC pauses freeze the event loop or goroutines. These pauses are short but affect every request that happens to land during the pause.
- Connection pool exhaustionWhen the database connection pool is full, requests queue. The first 95% get a connection immediately; the last 5% wait for one to free up.
- Downstream dependency slownessYour API might be fast, but if it calls a third-party service that is slow 5% of the time, your P95 inherits their P95.
- DNS and TLS overheadThe first request to a new host incurs DNS lookup and TLS handshake costs. Subsequent requests reuse the connection. This disproportionately affects P95 during traffic spikes when new connections are established.
For a detailed breakdown of how DNS, TLS, and TTFB contribute to latency, see our guide on REST API performance metrics.
Start Monitoring P95 Latency Today
If you are only tracking average response time, you are missing the metric that matters most for real user experience. P95 latency shows you what your slowest regular users actually feel, and it is the foundation of any meaningful SLA or performance budget.
Start by adding P95 to the dashboards and alerts you already have: in Prometheus with histogram_quantile(0.95, ...), in Datadog with a p95 query, or through multi-region health checks on every monitored endpoint. Alert on P95 crossing your target, not on the average.
Frequently Asked Questions
What is P95 latency?
P95 latency (95th percentile latency) is the response time below which 95% of all requests complete. If your P95 is 400ms, it means 95 out of every 100 requests finish in 400ms or less, and only 5 out of 100 are slower. It captures the experience of your slowest typical users, unlike average latency which hides outliers.
Why is P95 latency better than average response time?
Average response time is misleading because a small number of extremely fast or slow requests can skew the number. An API with an average of 200ms might have 5% of users waiting over 2 seconds. P95 latency exposes this tail latency that averages hide. For SLAs and real user experience, percentile metrics give a more honest picture of performance.
What is a good P95 latency for a REST API?
For a standard REST API, a good P95 latency target is under 500ms. Internal microservice APIs should aim for under 100ms P95. GraphQL APIs typically target under 800ms P95 due to query complexity. Webhook delivery endpoints should stay under 1000ms P95. These targets vary by use case, payment APIs often need stricter targets than content APIs.
How do I calculate P95 latency?
To calculate P95 latency: collect all response times for a given period, sort them in ascending order, and find the value at the 95th percentile index (0.95 multiplied by the total count). In practice, monitoring tools like Datadog and Prometheus calculate this automatically using histograms or digest algorithms like t-digest for streaming data. In Prometheus you use histogram_quantile(0.95, ...).
What is the difference between P95 and P99 latency?
P95 latency is the response time that 95% of requests beat (the slowest 1 in 20 are slower), while P99 is the response time that 99% of requests beat (the slowest 1 in 100 are slower). P99 captures rarer, more extreme outliers like cold starts and lock contention, but it is noisier. Use P95 for alerting and SLAs because it is stable; use P99 for debugging the worst tail of your latency distribution.
Is 95ms latency good?
A P95 latency of 95ms is excellent for almost any API, it is well under the 500ms target for public REST APIs and even beats the 100ms target for internal microservices. Note that "95 latency" usually refers to P95 (the 95th percentile), not 95 milliseconds. What matters is that 95% of your requests complete under your target, measured per endpoint rather than as a single global number.
What is P50, P90, and P99 latency?
P50 (median) is the response time half of requests beat, your typical user's experience. P90 is the response time 90% of requests beat. P99 is the response time 99% of requests beat, the worst-case tail for all but 1 in 100 requests. Together with P95, these percentiles describe your full latency distribution far more honestly than a single average, which is skewed by outliers.