Your Stripe webhook endpoint processes payment confirmations. It's been returning 500 errors for the last 2 hours. Stripe retried 3 times, gave up, and moved on. You have 47 unprocessed payments. You find out tomorrow from a customer email.
Webhooks are the most fragile integration point in modern applications — and the least monitored. The sender fires and forgets. If your endpoint fails, nobody tells you.
Why Webhooks Are Hard to Monitor
- Incoming traffic, not outgoing. You don't control when webhooks arrive. You can't test them on demand.
- No consistent error reporting. Stripe has a dashboard with delivery logs. GitHub has delivery history. Your custom B2B partner sends webhooks with no logging at all.
- Silent failures. A webhook that returns 200 but doesn't process the payload correctly is worse than a 500 — the sender thinks it succeeded.
- Retry masking. Providers retry failed deliveries. If your endpoint fails once and succeeds on retry, you never see the failure — but the delayed processing might cause issues.
What to Monitor
| Metric | Why it matters | Alert threshold |
|---|---|---|
| Success rate | Percentage of webhooks processed without error | < 99% sustained |
| Response time | Stripe times out at 20s, GitHub at 10s | > 5 seconds |
| Error rate by type | 4xx (bad payload) vs 5xx (your bug) vs timeout | Any 5xx spike |
| Throughput | Expected vs actual events — sudden drop means the sender stopped or your endpoint is rejecting | Drop > 50% |
| Processing lag | Time between event creation and your processing | > 5 minutes |
Webhook Timeouts by Provider
| Provider | Timeout | Retries | Retry window |
|---|---|---|---|
| Stripe | 20 seconds | Up to 3 | 48 hours |
| GitHub | 10 seconds | Up to 3 | ~hours |
| Shopify | 5 seconds | 19 times | 48 hours |
| Twilio | 15 seconds | Configurable | Configurable |
| Slack | 3 seconds | 3 times | 30 minutes |
If your webhook endpoint takes 6 seconds to process a Shopify event, it times out every time. You'd never know unless you monitor response times.
Best Practices for Webhook Endpoints
1. Return 200 immediately, process async
    // Bad: process in the request handler (can timeout)
export async function POST(request: Request) {
  const event = await request.json()
  await processPayment(event)       // Takes 8 seconds
  await updateDatabase(event)       // Takes 3 seconds
  await sendConfirmationEmail(event) // Takes 2 seconds
  return Response.json({ received: true }) // 13 seconds — TIMEOUT
}

// Good: acknowledge and queue
export async function POST(request: Request) {
  const event = await request.json()
  await queue.send({ type: 'webhook', payload: event })  // 50ms
  return Response.json({ received: true })  // 50ms — done
}
2. Verify webhook signatures
    // Stripe signature verification
import Stripe from 'stripe'

export async function POST(request: Request) {
  const body = await request.text()
  const sig = request.headers.get('stripe-signature')

  try {
    const event = stripe.webhooks.constructEvent(
      body, sig!, process.env.STRIPE_WEBHOOK_SECRET!
    )
    // Process verified event
  } catch (err) {
    return new Response('Invalid signature', { status: 400 })
  }
}
3. Implement idempotency
Providers retry. Your endpoint might process the same event twice. Use the event ID as an idempotency key — check if you've already processed it before doing anything.
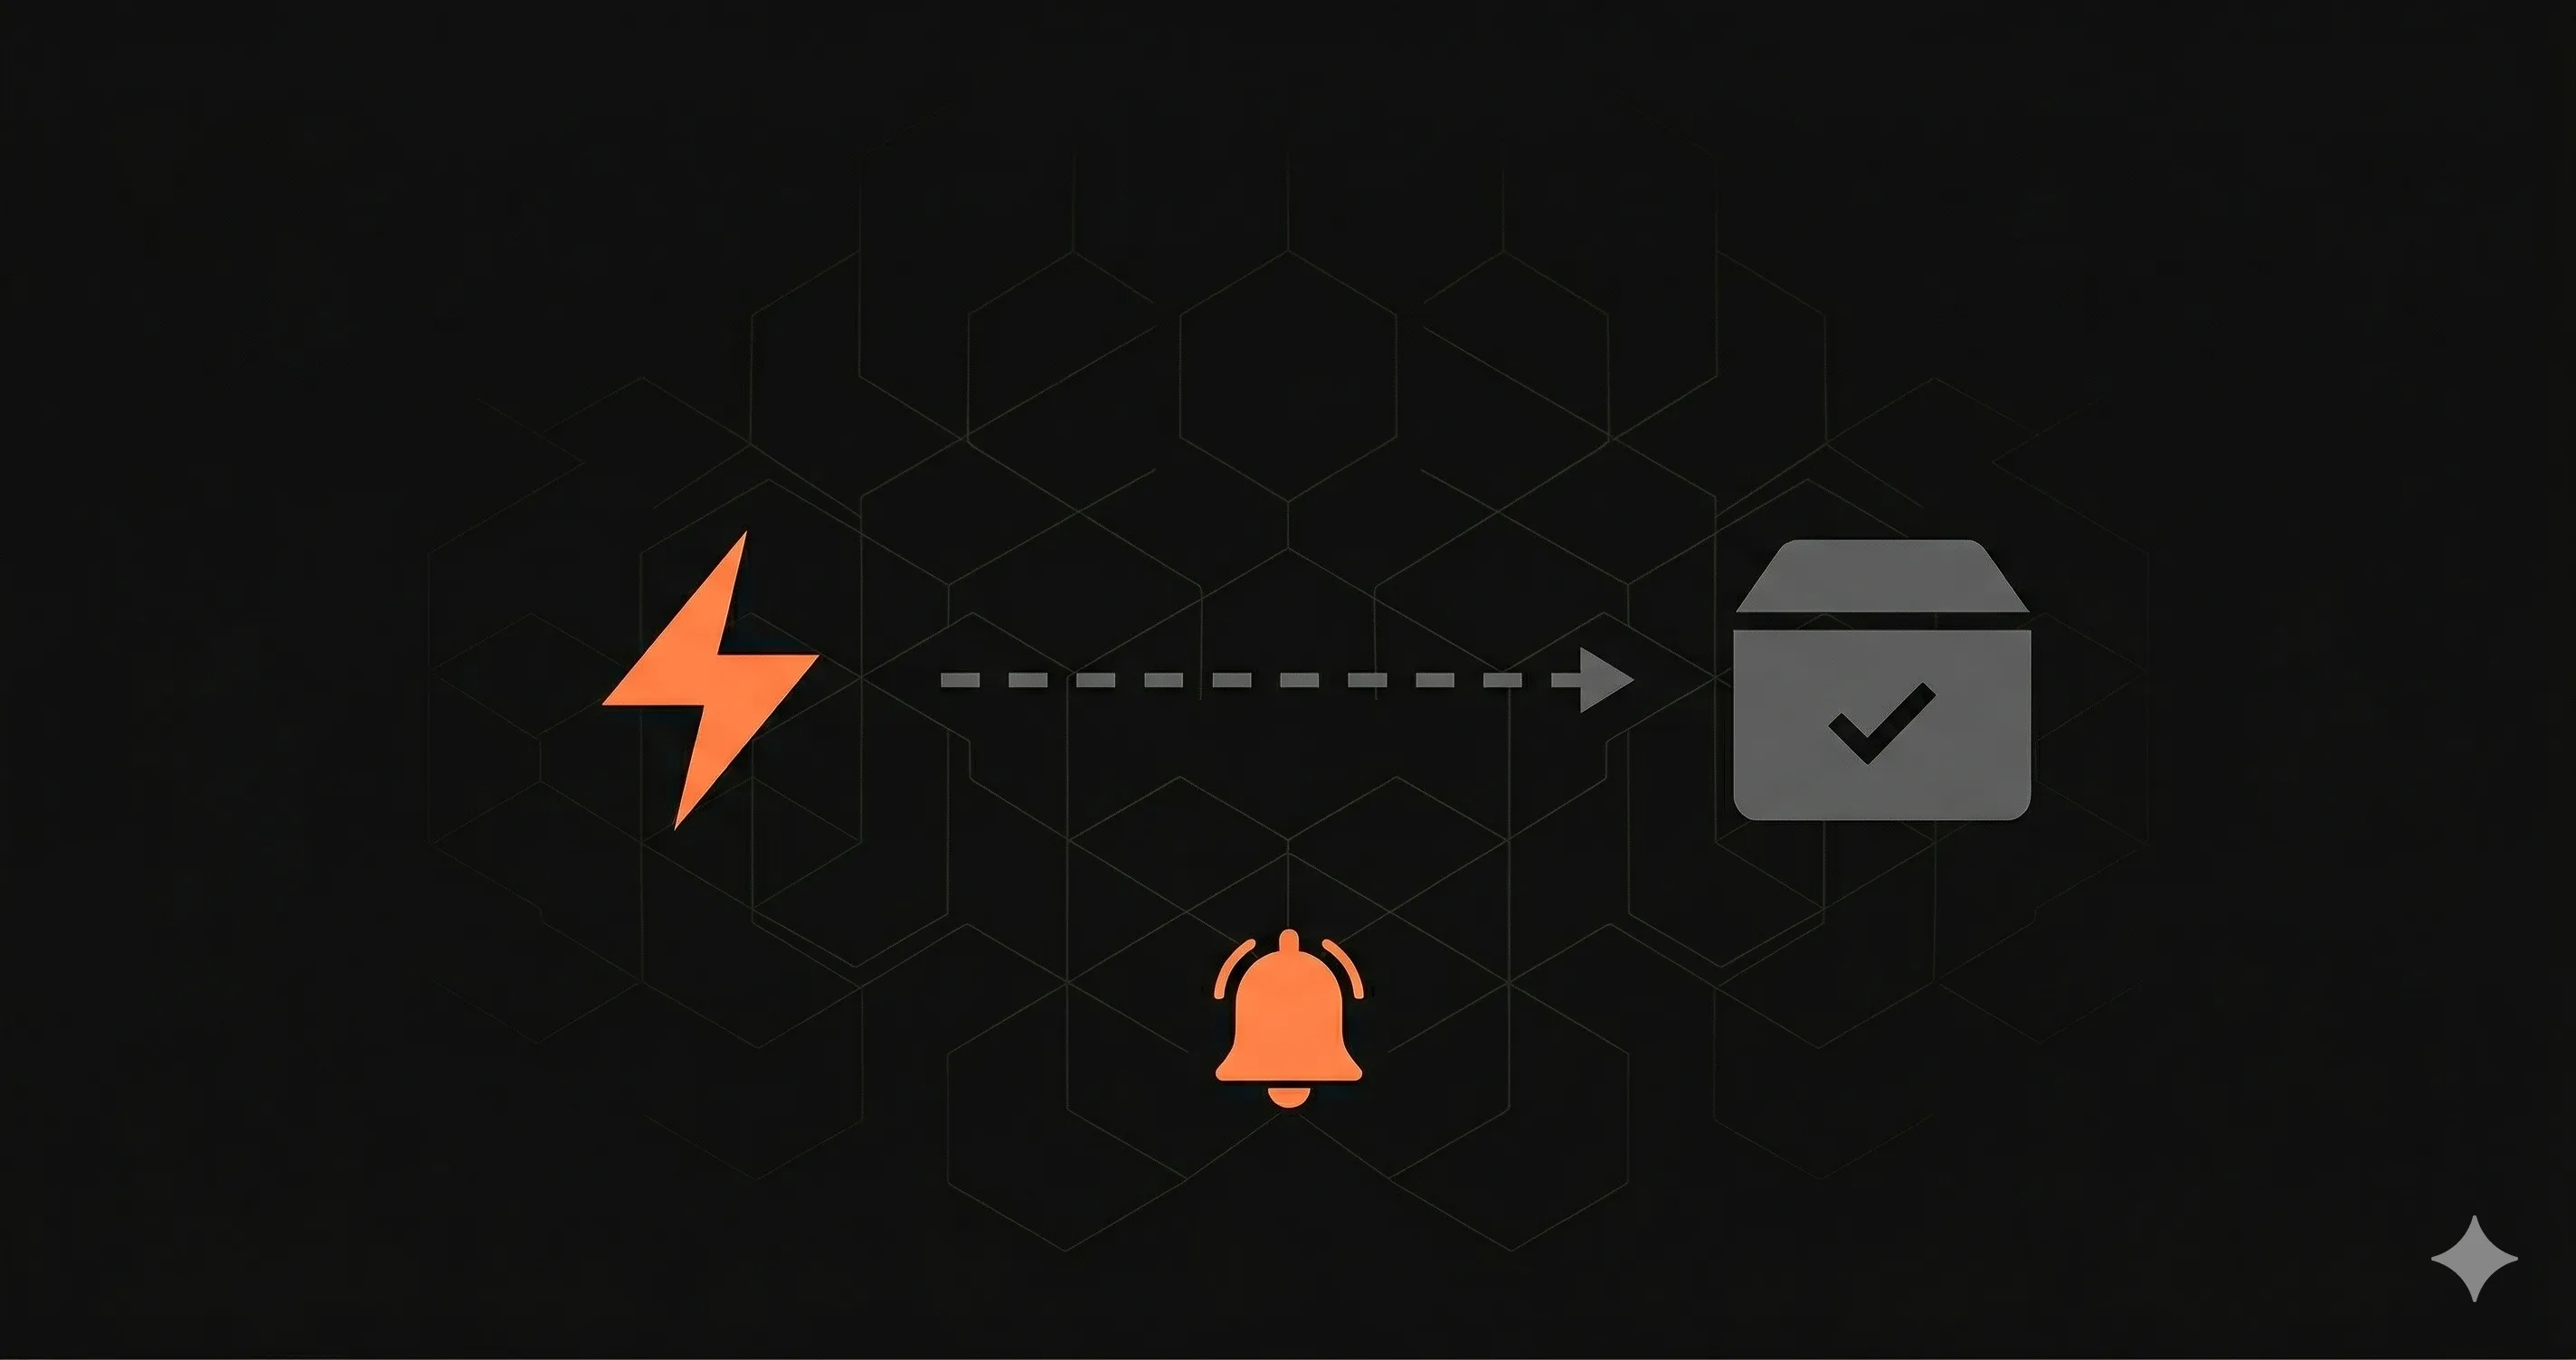
Monitoring Webhook Endpoints with Nurbak Watch
Since webhooks are just API routes, Nurbak Watch monitors them automatically alongside all your other endpoints:
    // instrumentation.ts — monitors ALL API routes including webhooks
import { initWatch } from '@nurbak/watch'

export function register() {
  initWatch({
    apiKey: process.env.NURBAK_WATCH_KEY,
  })
}
Your /api/webhooks/stripe and /api/webhooks/github endpoints get the same P50/P95/P99 latency tracking, error rates, and instant alerts as every other route. When your Stripe webhook starts returning 500s, you get a WhatsApp alert in 10 seconds — not a customer email in 10 hours.
Free during beta. 5 lines of code.