Your Next.js app is in production. Users are hitting your API routes. But how do you know if /api/users is responding in 200ms or 2000ms? How do you know if your payment webhook is returning 500 errors at 3 AM?
Most developers deploy and hope for the best. In this guide, you'll learn how to set up proper API monitoring for your Next.js routes — with automated health checks, latency tracking, and instant alerts — in under 5 minutes.
Why Monitor Next.js API Routes?
Next.js API routes are serverless functions under the hood (on Vercel) or Express-like handlers (on Node). Either way, they can fail silently:
- Cold starts can spike latency from 50ms to 2000ms+
- Database connections can time out without visible errors
- Third-party APIs (Stripe, Auth0, etc.) can degrade and cascade failures
- SSL certificates can expire and break all HTTPS traffic
- DNS changes can propagate incorrectly across regions
Without monitoring, you only find out when users complain — or when revenue drops.
What to Monitor
For each API route, you should track:
| Metric | Why it matters |
|---|---|
| Response time (P95) | Catches latency spikes that affect 5% of requests |
| HTTP status codes | Detects 4xx/5xx errors in real-time |
| DNS lookup time | Reveals DNS propagation issues |
| TLS handshake time | Catches certificate or configuration problems |
| TTFB | Measures server processing time (excluding network) |
| Uptime percentage | Tracks overall availability (target: 99.9%+) |
| SSL expiry | Prevents surprise certificate expirations |
Step 1: Install the Monitoring SDK
Add the Nurbak Watch SDK to your Next.js project:
npm install @nurbak/watchThis is a lightweight package (< 10KB) with zero dependencies. It won't affect your bundle size or cold start time.
Step 2: Add the Instrumentation File
Create instrumentation.ts in your project root (Next.js 13.4+ supports this natively):
import { initWatch } from '@nurbak/watch'

export function register() {
  initWatch({
    apiKey: process.env.NURBAK_WATCH_KEY,
  })
}
That's 5 lines of code. No YAML files, no agent configuration, no dashboard setup. The SDK automatically discovers your API routes and starts reporting health data.
Step 3: Configure Alerts
In the Nurbak dashboard, configure when you want to be notified:
- API Down — endpoint returns errors or is unreachable
- High Latency — response time exceeds your threshold (e.g., > 2000ms)
- Error Rate — 4xx/5xx percentage exceeds threshold (e.g., > 10%)
- SSL Expiry — certificate expires within N days (e.g., < 14 days)
Alerts can be sent to:
- Slack — via webhook (Block Kit formatted messages)
- Email — instant delivery via Resend
- WhatsApp — direct message to your phone
- SMS — for critical alerts when you're away from your desk
Step 4: Deploy and Verify
Deploy your app normally. Within 5 minutes, the first health check will run. You'll see your endpoints appear in the dashboard with real-time metrics:
- Response time trends (30-day chart with P95)
- Uptime percentage per endpoint
- Active incidents and their duration
- SSL certificate status and expiry date
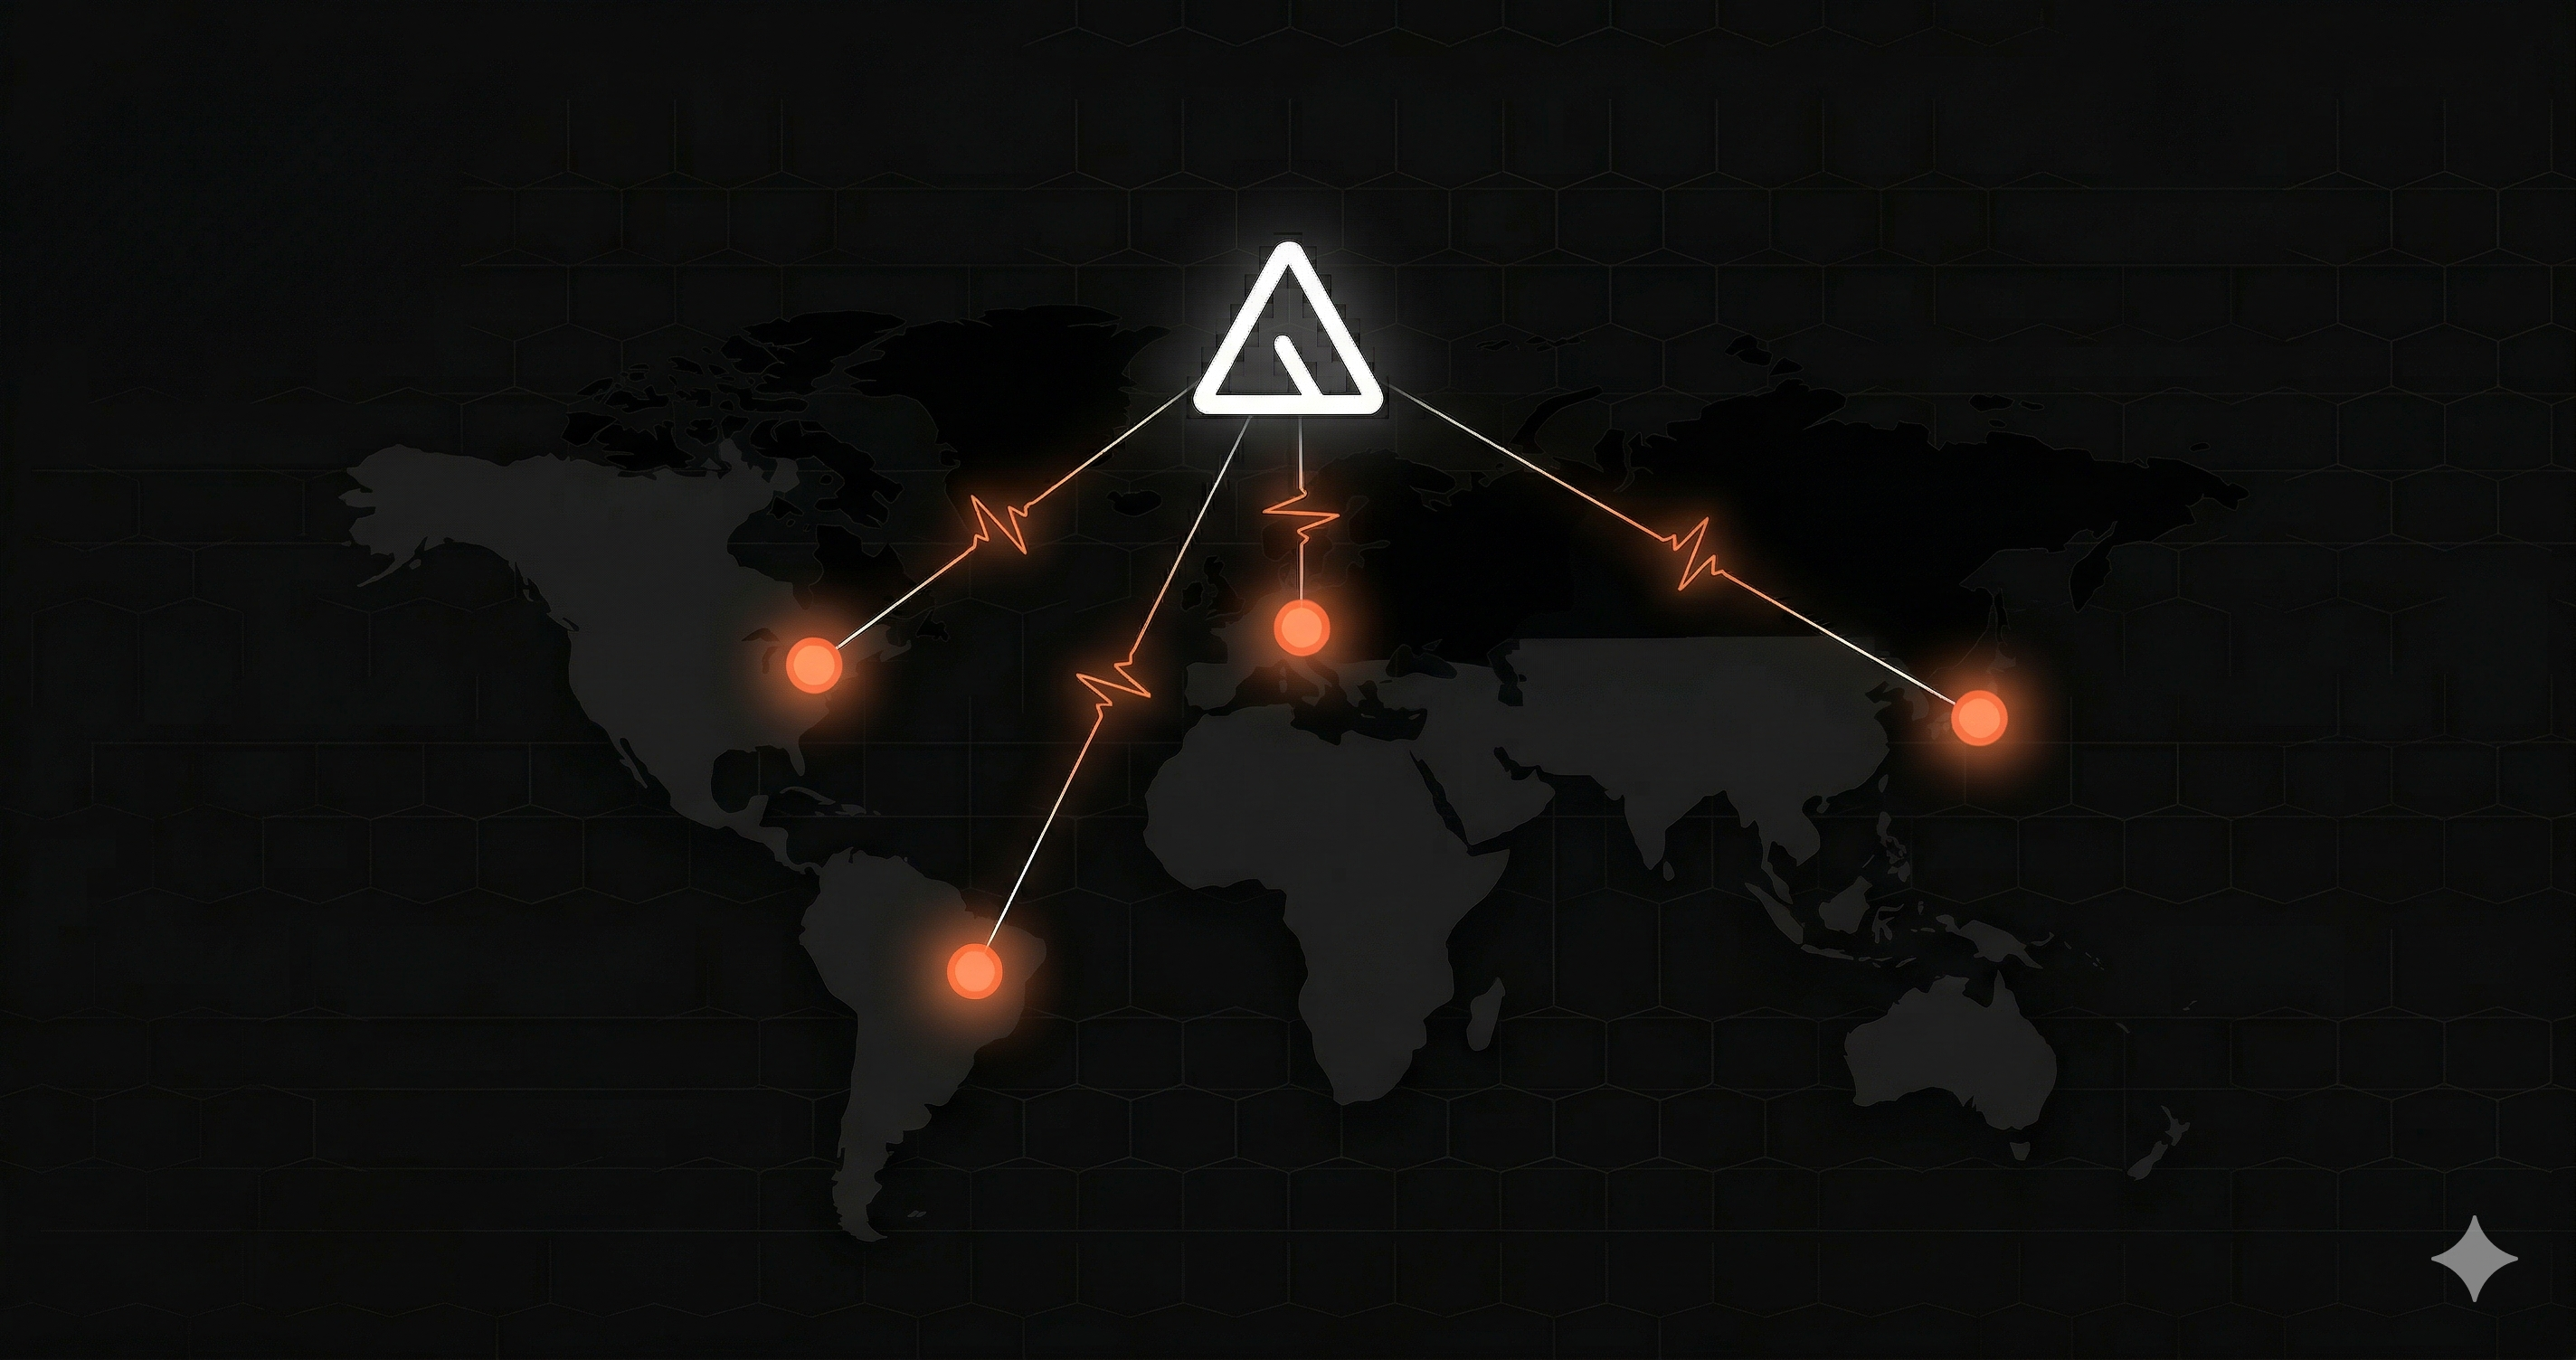
Multi-Region Monitoring
One of the biggest advantages of dedicated monitoring is checking from multiple locations. Nurbak runs health checks from 4 regions:
- Virginia, US — North America
- São Paulo, Brazil — South America
- Paris, France — Europe
- Tokyo, Japan — Asia Pacific
This means you can detect regional outages — like when your Vercel deployment is healthy in the US but timing out from Europe due to a CDN issue.
What About Vercel Analytics?
Vercel provides basic analytics and logging, but it's not a monitoring solution:
- No automated health checks from external regions
- No proactive alerts (you have to check the dashboard manually)
- No P95/P99 latency percentiles per endpoint
- No SSL certificate monitoring
- No incident tracking with duration
Vercel Analytics tells you what happened. Monitoring tells you the moment it happens — and wakes you up if needed.
Free Tier
Nurbak's free plan includes everything you need to get started:
- 1 project, 3 endpoints
- Health checks every 5 minutes from 1 region
- Email alerts for downtime
- 30-day uptime history
- No credit card required
For teams that need faster checks (every minute), multi-region monitoring, and Slack/WhatsApp alerts, the Pro plan is $29/month.
Summary
Monitoring your Next.js API routes takes 5 minutes and 5 lines of code. You get automated health checks from 4 global regions, P95 latency tracking, and instant alerts on Slack/email/WhatsApp. Don't wait for users to report outages — know first.